

We recently completed a two-month internship with The Group on Earth Observations Biodiversity Observation Network (GEO BON). Its headquarters having recently moved to Montreal, we immediately wanted to be part of this new chapter by contributing to a project as exciting as it is ambitious: an integrated biodiversity information system. GEO BON is indeed currently developing such an information system that would, among other things, provide real-time estimates of many biodiversity indicators at the planetary scale. Another purpose of GEO BON’s information system is to facilitate the conduction of biodiversity forecasts under different socioeconomic scenarios and enhance the plausibility and precision of these models.
When implemented, this tool could be highly valuable for both the scientific community and environmental managers alike. Unlike our enthusiasm and excitement for the broader project, our contribution had to be finite (!). Our role, as interns, was to develop a forecasting model of local contributions to beta diversity (LCBD), a measure of a site’s ecological uniqueness in terms of species composition, of warbler species at the regional scale. Our work served as a proof of concept for GEO BON’s project and helped identify potential pitfalls in terms of data availability and computing resources.
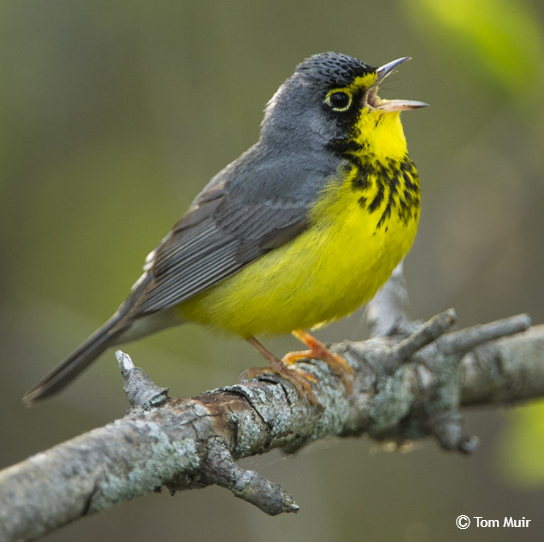
A warbler (not identified but identifiable), unaware of all the modeling we did on its taxon.
Warbler species have the desirable property of being objectively beautiful. They are a diversified group of colorful birds in America, which makes people appreciate collecting data on them. This is mostly why we have a lot of occurrence data on them and why we chose to model their distribution in our study. Before forecasting their distribution, we first conducted a species distribution model (SDM) with contemporary data, in order to learn how environmental and land-use data drive current species occurrence. We conducted the SDM in Quebec and Colombia, not only because of their large spatial extents, but also because they represent completely different ecosystems with different historical anthropogenic impacts. Occurrence data were taken from the eBird database, whereas environmental data (temperature and precipitation) were obtained from the Chelsa database. Land-use data, for their part, were taken from the Oak Ridge National Laboratory Distributed Active Archive Center (ORNL DAAC). We conducted our SDM separately for all species and in the two regions of interest using Bayesian additive regression trees (BARTs). Next, we forecasted species distributions in 2050 and 2070 using forecasted environmental and land-use data, generated under the MIROC climate model and the RCP 6.0 scenario, as inputs to the previously trained model. Those years were chosen purely based on data availability. Warbler communities were then predicted in each grid cell by stacking all single-species predictions (stacked-SDM) for every year studied (2020, 2050, and 2070). Finally, LCBD values were directly measured on these predicted communities. You can see our results for the years 2020 and 2050 below.
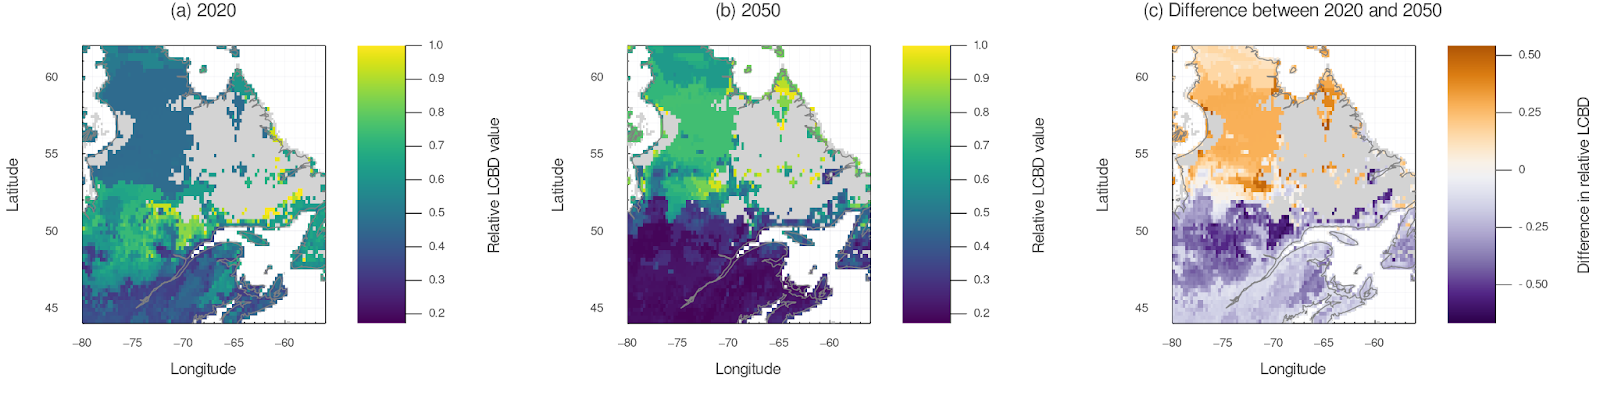
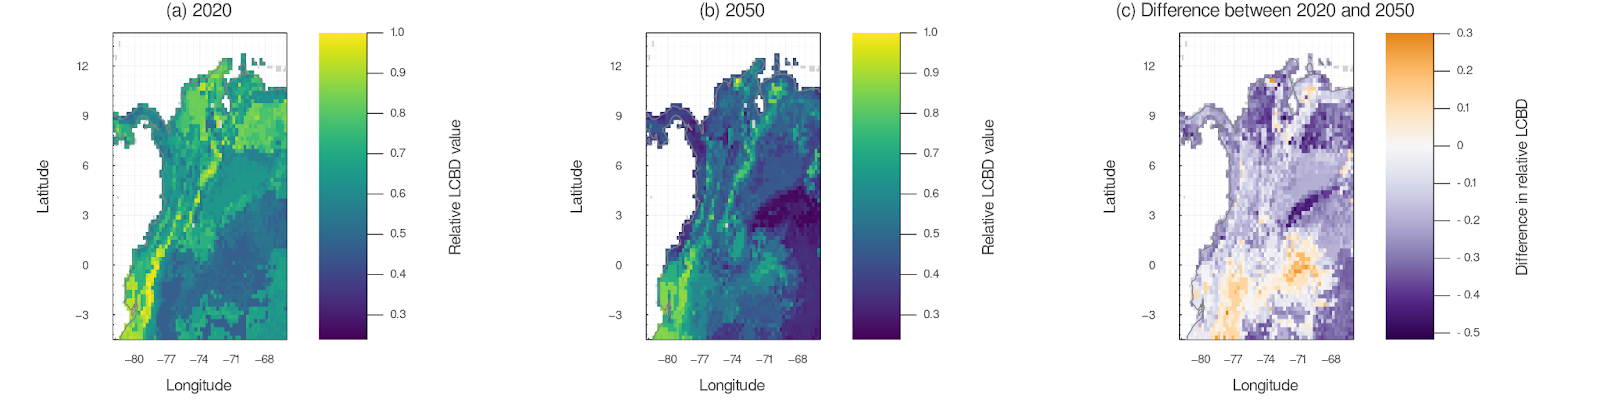
Relative LCBD values in Quebec (top panels) and Colombia (bottom panels) in 2020 (left panels) and 2050 (center panels). The right panels show the difference in relative LCBD between the two years.
We found a strong latitudinal gradient of relative LCBD differences between the two years in Quebec. Whereas warbler communities in southern Quebec are expected to become less unique (relative to all warbler communities, or grid cells, in Quebec), northern Quebec might house more unique communities in the upcoming years. We believe this might be the result of species migration to higher latitudes, as well as a homogenization of species composition in southern Quebec. Although this latitudinal gradient is not apparent in Colombia, we see how the Andes Mountains usually host more unique communities in both years, in part because of their higher species richness in comparison to surrounding areas.
In general, our work is promising as it shows how different data sources can be combined to forecast biodiversity indicators (here, LCBD) at large spatial scales, an important first step in the development of GEO BON’s extensive biodiversity information system. Taking a step back, we think our internship was a good methodological exercise for us, as it allowed us to find, integrate, and manipulate different types of biological and environmental data. It also enabled us to develop new modeling skills, especially related to forecasting models, that we probably wouldn’t have developed in our mostly linear academic path.
This piece of writing is the first of two blog posts on our internship experience with GEO BON. The following post will discuss in more depth our learning experience regarding data availability. With this series of articles, we hope that we can spark your enthusiasm in pursuing such a science-driven internship in the not too distant future! Stay tuned!
Francis Banville, Gabriel Dansereau and Samuel Provencher-Tardif
Written on October 25th, 2021