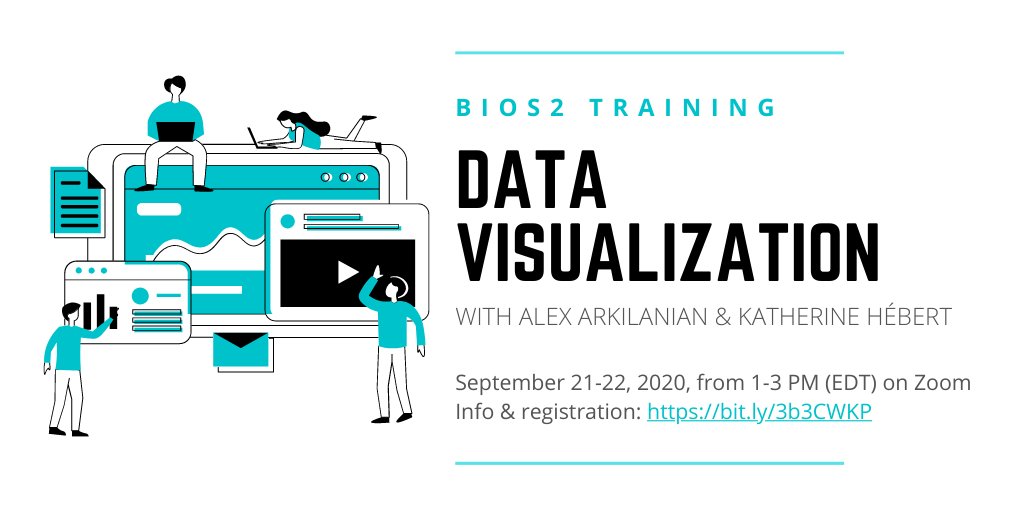
There has been a change in dates for the Data Visualization workshop.
The training will be held on October 13-14 @ 1-3 PM (EDT) instead of September 21-22, 2020.
We are pleased to propose another training as part as our series: Training by BIOS² Fellows!
Katherine Hébert and Alex Arkilanian we will be offering a training session on Data Visualization (in English) to be held on October 13-14 from 1-3 PM (EDT).
The training will be split into two sessions, which will covers the general principles of visualization and graphic design, and techniques of tailored visualization. Each training will take the form of a presentation interspersed with several short activity modules, where participants will be invited to use the tools we will be discussing to practice their data visualization skills.
More specifically, the objectives of the training are:
- Make an overview of basic data visualization principles, including shapes, sizes, colours, and fonts
- Discuss how to choose the right visualization for your data, what you want to communicate, and who you want to communicate to
- Tools and principles to tailor visualizations, particularly in making interpretable, interactive, and honest visualizations
The training will consist of:
- Presentations with activities in breakout rooms, in Google Docs, or on an Etherpad, with group discussions to summarize key points
- A wrap-up discussion at the end of each session
- Reference handout to code figures shown in the presentation
- Annotated library of resources to consult and share
To register, please fill out this short form: http://bit.ly/bios2_TS_DataViz_v2
If you registered to the workshop in planned on September 21 and 22, please fill out this form again to confirm you participation.
Registrations will be accepted until October 12. A link to attend the training will be sent to you early October 13, 2020.
For more information, you can contact info.bios2@usherbrooke.ca
Photo: Carlos Muza | Unsplash

